Perfion's dashboard
The dashboard is an efficient, user-defined interface that may be the first thing you see when logging onto Perfion's web client.
[VIDEO] Introduction to dashboard functionality in the Perfion PIM system
The Perfion dashboard gives you a precise, clear overview of exactly the data you choose.
Presented with the most relevant data, you and your colleagues are ensured easy access to precisely those Perfion PIM system functions that you use the most.
When navigating through dashboard charts and widgets, you avoid spending unnecessary time searching for data, and you can move from A to B much faster.
With the Perfion dashboard, you can:
- Create custom charts that perfectly match the exact work you do with Perfion;
- Create charts for use outside of Perfion, e.g., in presentations or reports;
- Get faster access to relevant data;
- Make it easier for occasional users to work in Perfion; and
- Remove the hurdle for brand new users who need to access and/or edit PIM data.
You can customize your own widgets and charts
You can add as many widgets to your dashboard as you want. All widgets can be customized to your specific needs for grouping, categorizing and counting data. It is also possible to create widgets with more complex Perfion features, such as filters.
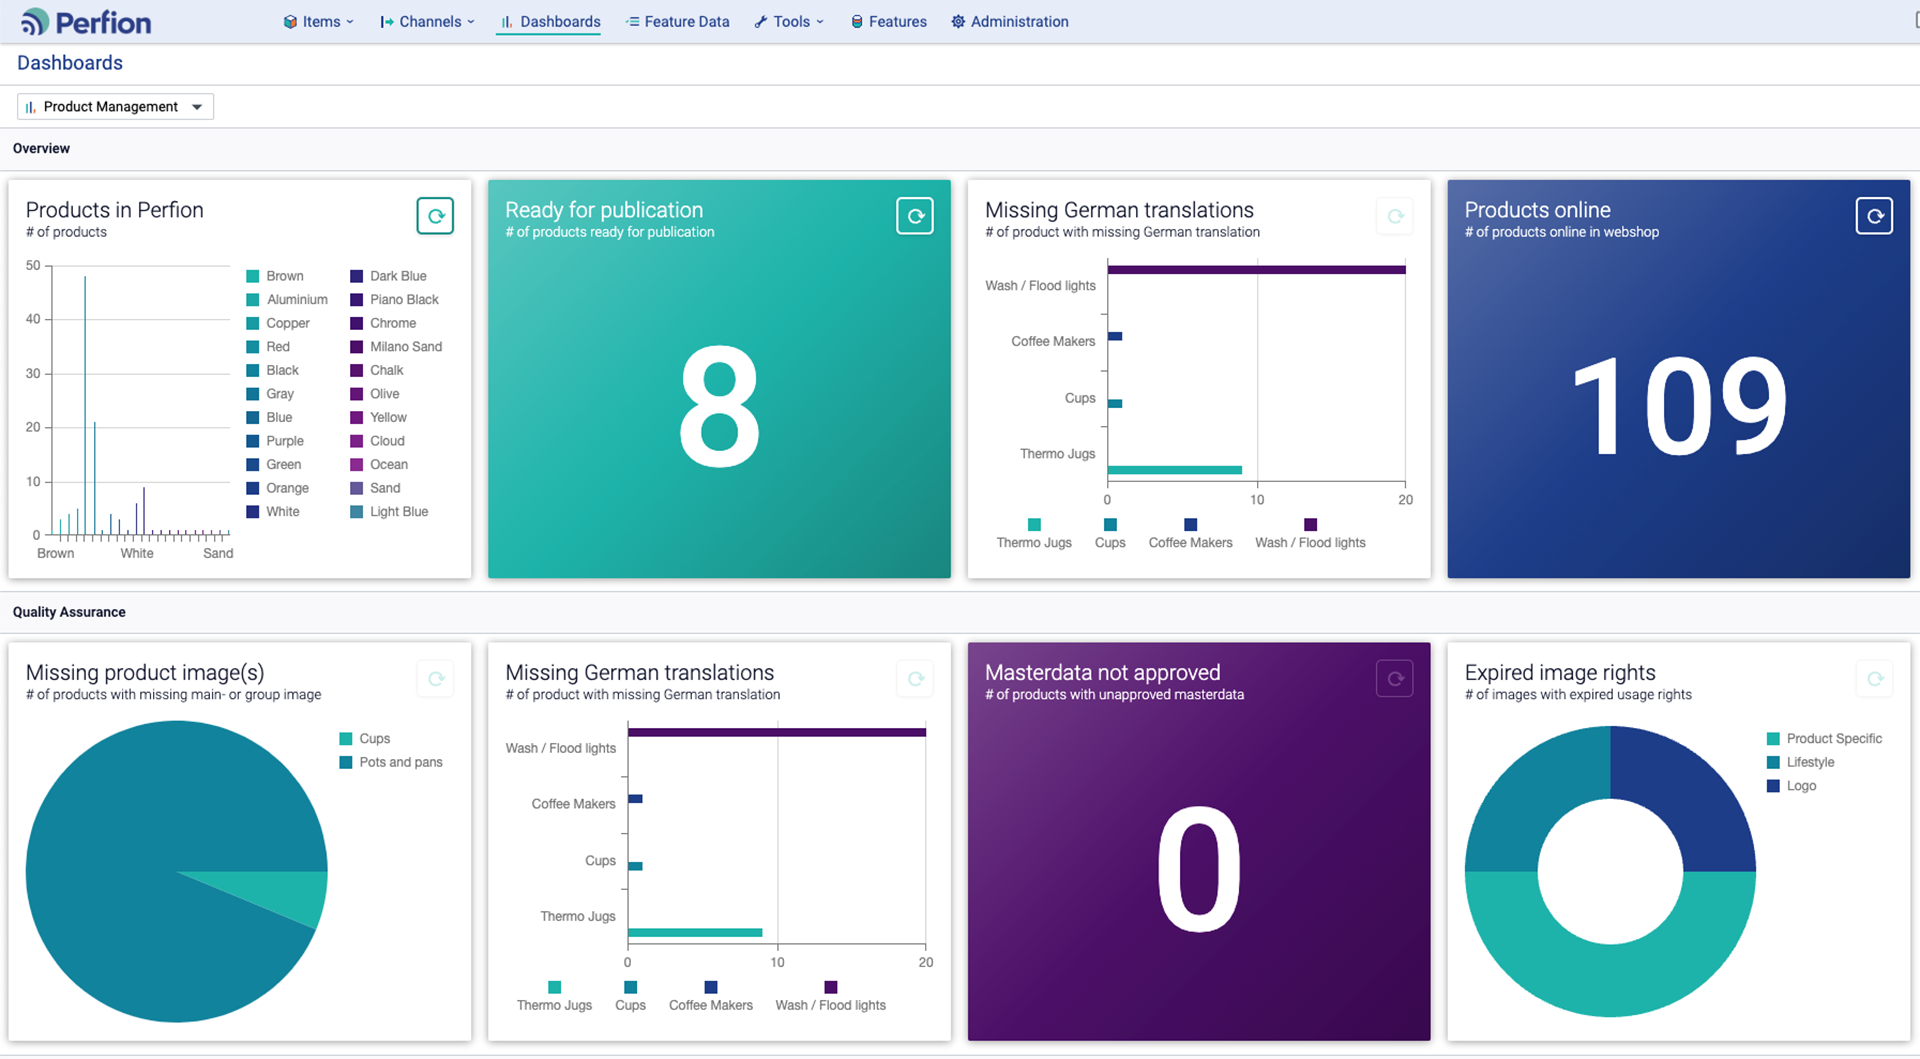
The custom Perfion dashboard above shows examples of different types of widgets and charts:
Vertical bar chart widget (Box 1)
The example in Box 1 shows the total number of products in Perfion by different categories, indicating the number of products in each category.
Count widget (boxes 2, 4 & 7)
Count widgets can show the total number of anything you choose. The examples in boxes 2 and 4 show – and are shortcuts to – the total amount of products ready for publication (8) and the number of products online in the webshop (109), respectively.
Horizontal bar chart widget (Box 3 & 6)
The example in Box 3 shows the products with missing German translations by different categories, indicating the number of products in each category. This type of widget can count any distribution by categories in Perfion.
Circuit diagram widget (Box 5)
The example in Box 5 shows the number of products with missing main or group image. Pie chart widgets can be used both to display this type of breakdown by categories, as bar chart widgets do, and as “with/without” views of products marked for example either “ready” or “not ready”.
Donut chart widget (Box 8)
The example in Box 5 shows the proportion of images with expired usage rights. This widget is primarily used for “with/without” views, where you want to check the status of something very specific, e.g., whether a product “lacks an image”, is “ready for publication”, etc.
With a single click...
Not all users need all the advanced features that Perfion has to offer. For example, some will just want to access the products relevant to their own workflow with a single click on a point on a chart.
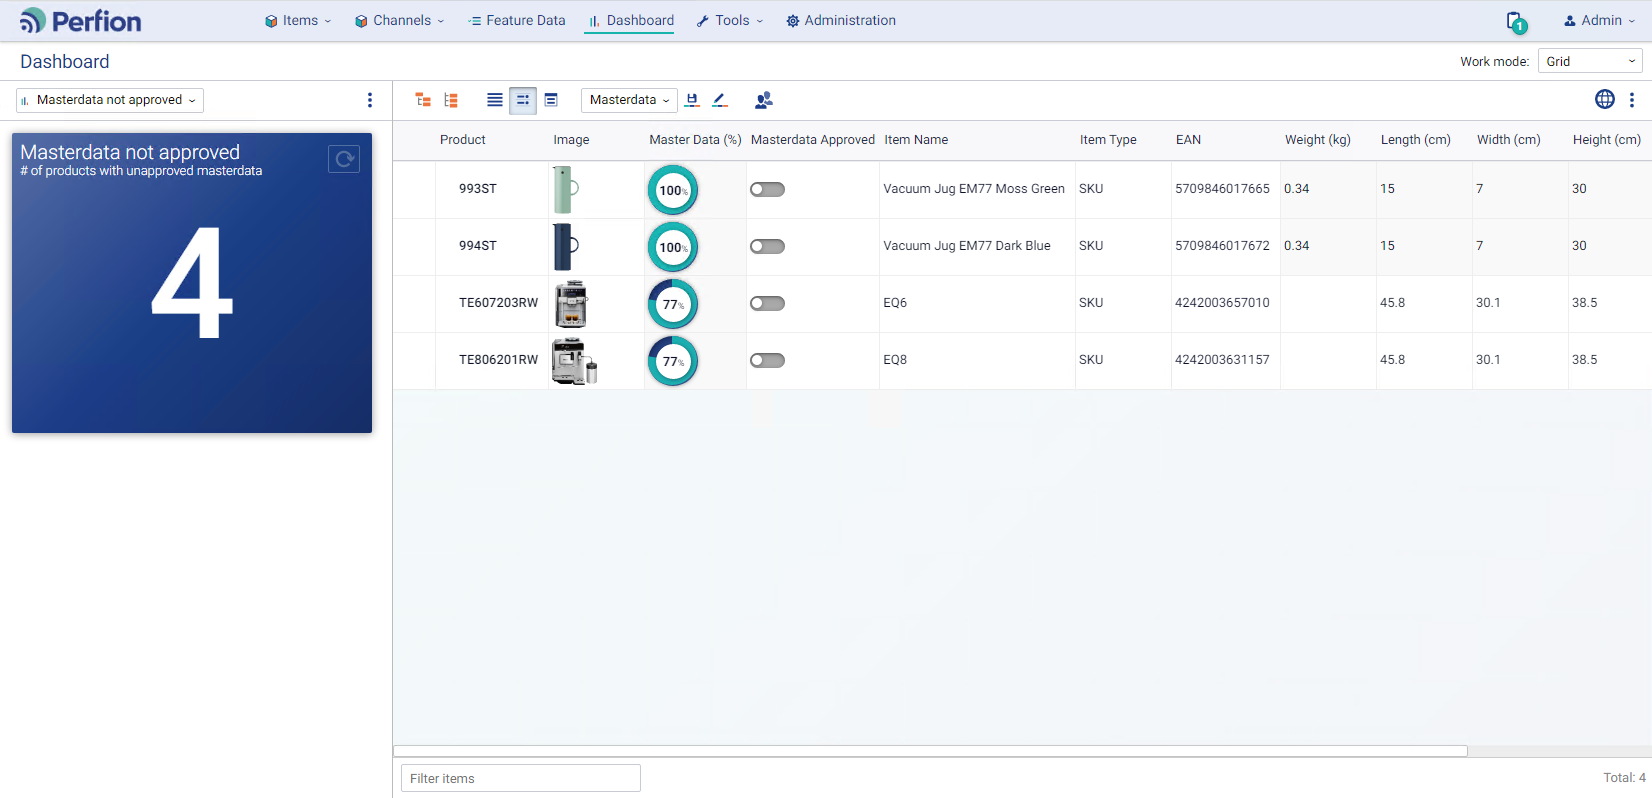
Perfion's dashboard can be customized so that both the occasional user and the PIM expert can meet their individual needs and wishes – from the simplest to the highly specialized.
It's all just a click away.
Still have questions?
Ask us anything.